スマートオンライントレード講座バウハウス
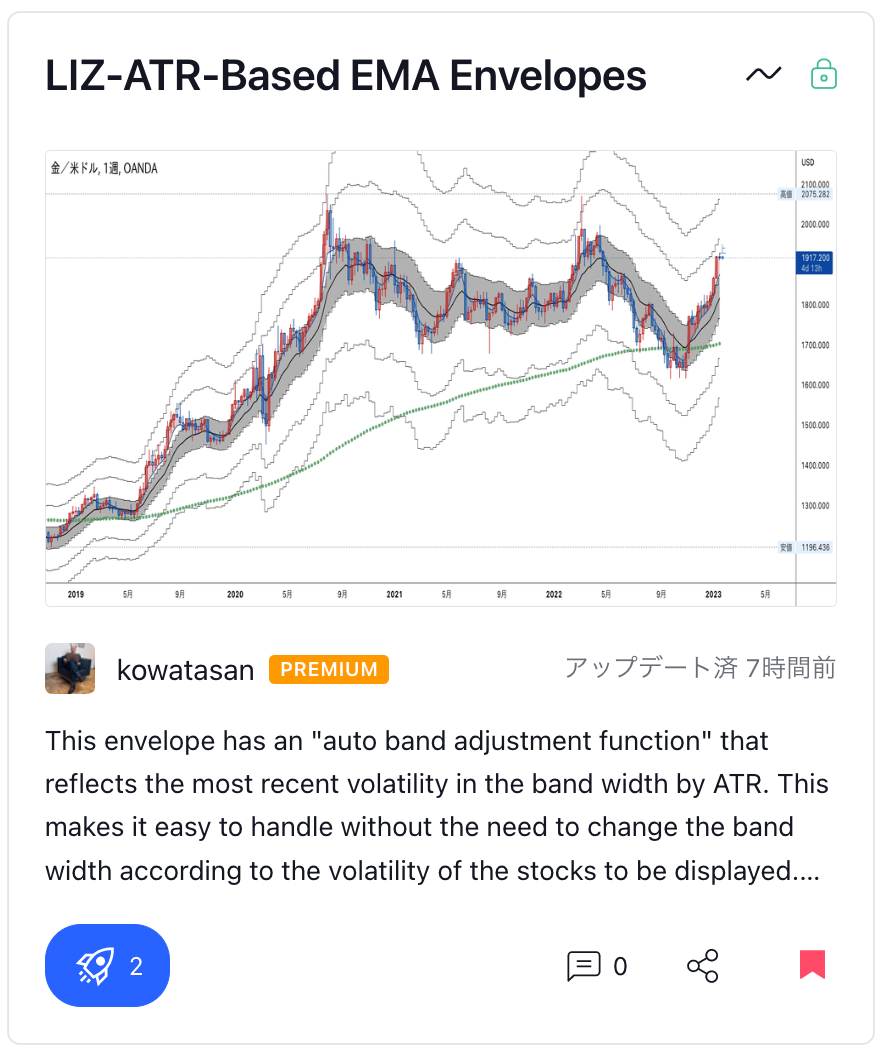
🌟 New release! ATR Based EMA Envelopes (with New Trend signature) Alumni-exclusive discount
🌟 New release! ATR Based EMA Envelopes (with New Trend signature) Alumni-exclusive discount
Couldn't load pickup availability
Introducing an envelope that does not require setting changes even if the brand is changed!
Feature ①
If the price diverges from the moving average line by more than a certain amount, it has the property of regressing (returning) to the moving average line. There are unique characteristics depending on the stock as to how much divergence is required to return.
The envelope indicates the rate of deviation from the moving average line. Depending on the stock displayed on the chart, such as forex, stocks, and indexes, the deviation that causes the trend to overshoot differs, so it was necessary to change the settings according to the stock.
In addition, since volatility changes depending on the time of year, there was a problem that the band width was too loose when it entered a low volatility period after a large volatility.
This envelope automatically adjusts the bandwidth according to the volatility, so there is no need to change the settings each time the stock changes or the volatility changes.
The price is supported by the moving average line, and there is no moving average line, and it grows in the direction of the trend, but when it diverges, the trend ends and it returns to the moving average line.
Therefore, if you display both the moving average line and the envelope, you can display resistance bands both in the direction of the trend and in the opposite direction, which can be used to determine entry exits.
🌟In addition to the above, there is a new way to use Envelopes!
Feature ②
The original purpose of the envelope is to detect overheating of the trend, but it can also be used to see the emergence of the trend.
A trend occurs when a certain amount of divergence from the moving average line occurs and the flow maintains the divergence rate above that. And it will end when the trend goes too far and reaches a certain rate of divergence.
This indicator colors the range of divergence where no trend occurs in gray, so when the flow exits the gray zone, it is possible to enter and pick up only the areas where the trend is strong.
Also, when the price is in the gray zone, the character "middle" will automatically light up, and when the price is above or below, the characters "upper" and "lower" will automatically light up.
From ①②, this indicator can be viewed and used like a Bollinger band as well as an envelope.
The moving average line, which is the central band of the envelope, is the same as the one displayed in the separate products "EMA" and "TimeDimenSion" , so it is possible to display them overlaid.
Tradingview's script information about this indicator is here
Click here for a seminar (archive video course) for mastering this indicator
*This indicator is given as a gift to those who have applied for the video course.
(You can apply for any of the envelope strategy seminars 1st, 2nd, and 3rd)