スマートオンライントレード講座バウハウス
AutuPilot+ W-Envelope (limited discount for graduates)
AutuPilot+ W-Envelope (limited discount for graduates)
Couldn't load pickup availability
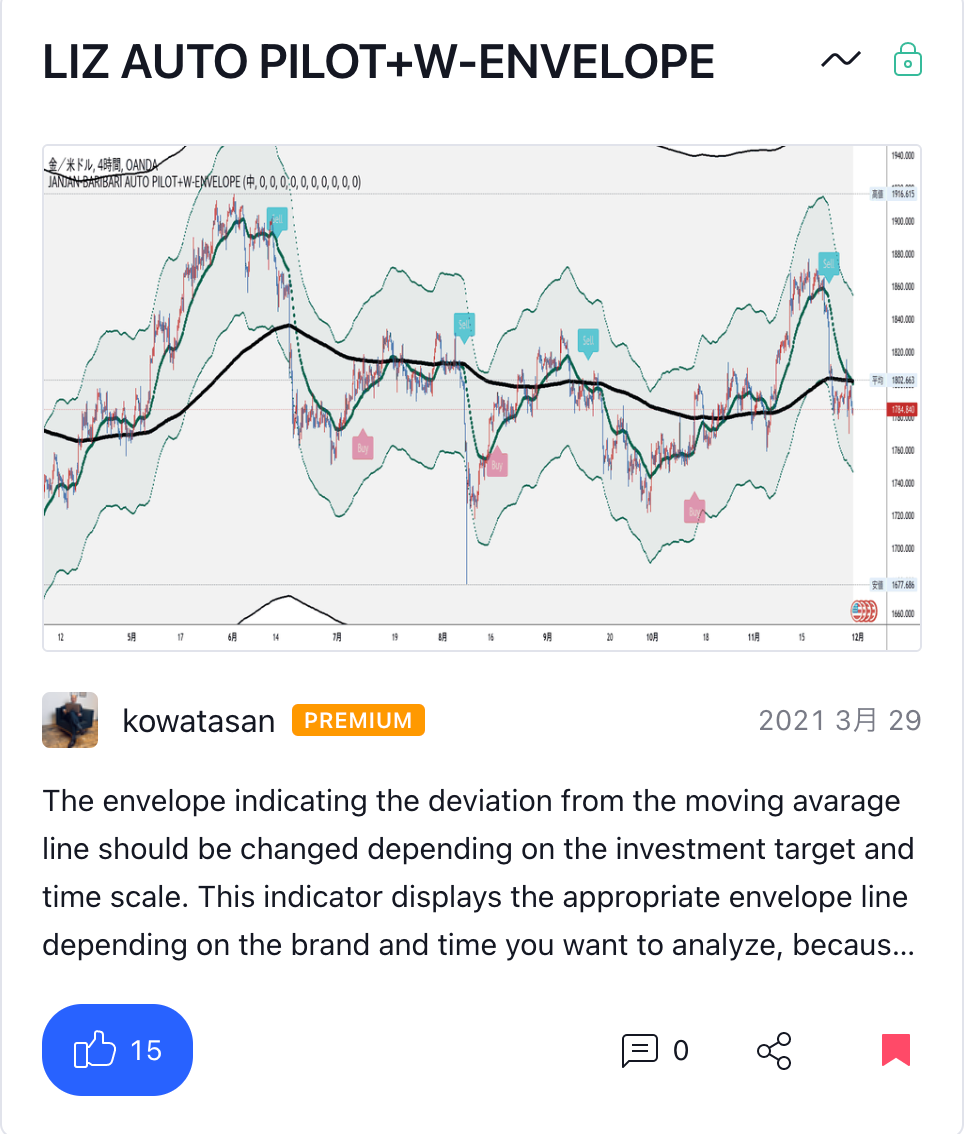
①AutoPilot is a signature tool.
It was created for the purpose of grasping the current direction for those who do not yet understand technical analysis at all, but it suggests that the flow has changed, so it is a sign in the opposite direction to the position you have. When is lit, it can be used to make a decision to take profit or stop loss.
Unlike vague signs such as line crossings, the letters "BUY" and "SELL" are clearly displayed, making it a tool that makes it easy to make a decision to cut losses.
Basically, if it lights up in the direction of the trend, it is also used for entry, but if it lights up when a large positive or negative line appears, there is a temporary deviation from the short-term moving average line. There is a trick.
In addition, if you are a middle-advanced trader who can understand the approach of highs and lows that can be confirmed on a long-term foot and the end of the Elliott count, you can ride the signs that appear in the opposite direction of the trend in a scene where a change is likely to occur, and hit the nadir. It is also assumed how to capture it.
There is a video that explains how to use it in detail, so if you are interested
② Envelope displays the deviation rate from the moving average line.
If the price diverges from the moving average line by more than a certain amount, it has the property of regressing (returning) to the moving average line. There are unique characteristics depending on the stock as to how much divergence is required to return.
Therefore, usually, every time the stock to be analyzed changes (for example, from exchange to stock stock), the set value (deviation rate) of the envelope to be displayed must be changed.
With this indicator, it is possible to switch the divergence rate setting with one touch.
The price is supported by the moving average line, and there is no moving average line, and it grows in the direction of the trend, but when it diverges, the trend ends and it returns to the moving average line.
Therefore, if you display both the moving average line and the envelope, you can display resistance bands both in the direction of the trend and in the opposite direction, which can be used to determine entry exits.
Two types of envelopes (short-term and medium-term) are displayed on one timeframe.
The moving average line that forms the central band is the same as that displayed in the separate products "EMA" and "TimeDimenSion", so it is possible to display them overlaid.
①②Two indicators are installed, and the setting screen is configured so that you can choose to hide one or display both.
Tradingview's script information about this indicator is here