スマートオンライントレード講座バウハウス
EMA (exclusive discount for graduates)
EMA (exclusive discount for graduates)
Couldn't load pickup availability
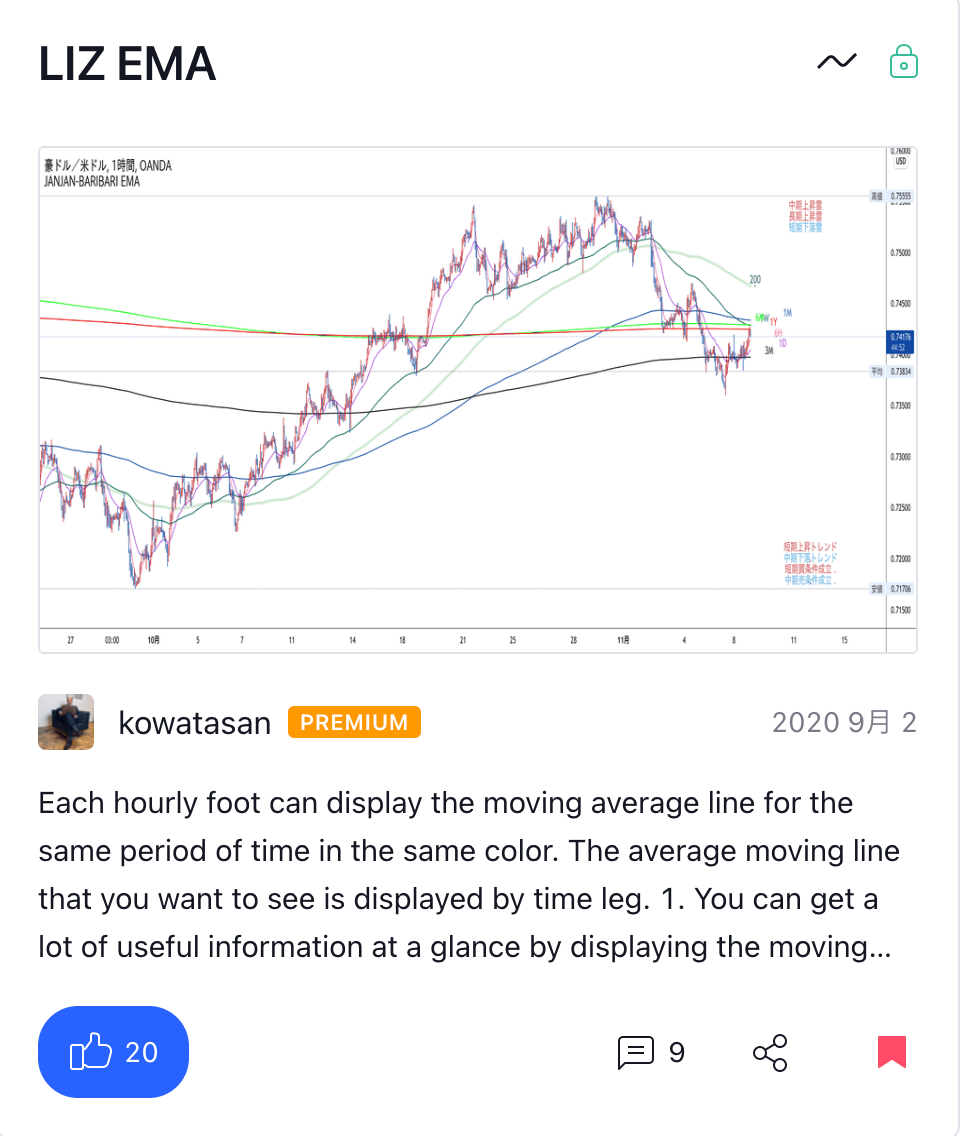
You can display a magic moving average line (EMA) that does not change its position even if you switch the timeframe.
Analysis information is displayed in text, so even beginners can easily understand it.
Moving averages are one of the most popular indicators. The indicators I provide look the same, but they are actually fundamentally different from the general ones.
It's very difficult to tell you what it means in writing every time, so I asked them to make a video that was summarized in a short time in an easy-to-understand manner.
Check out the video here.
Instead of horizontal resistance bands such as horizontal lines and Fibonacci, sloping resistance bands such as trend lines and parallel channels, moving average lines with high price sensitivity are automatically displayed in advance, so that even if you switch the timeframe, you will not get confused at all. So you will be able to look at the chart with completely different eyes than before.
Equipped with a character display function that is not displayed in the separate product "TimeDimenSion".
○ Contents of character display (A: period setting of moving average line displayed on each time frame)
(B: Acceptance/failure of the trading criteria based on the positional relationship between the trading criteria line and the price)
(C: Trend status according to the positional relationship between short-term and medium-term Bollinger bands and prices)
(D: 3 types of moving average line pairs of 2 pairs each and information)
In order to display all moving averages, Bollinger bands, and character information, we recommend reading two EMAs and TimeDimenSion and displaying them overlaid.
Tradingview's script information about this indicator is here
Share