1
/
of
1
スマートオンライントレード講座バウハウス
⑨Resistance & Support Lines by Time DimenSion
⑨Resistance & Support Lines by Time DimenSion
Regular price
¥3,000 JPY
Regular price
¥10,000 JPY
Sale price
¥3,000 JPY
Taxes included.
Quantity
Couldn't load pickup availability
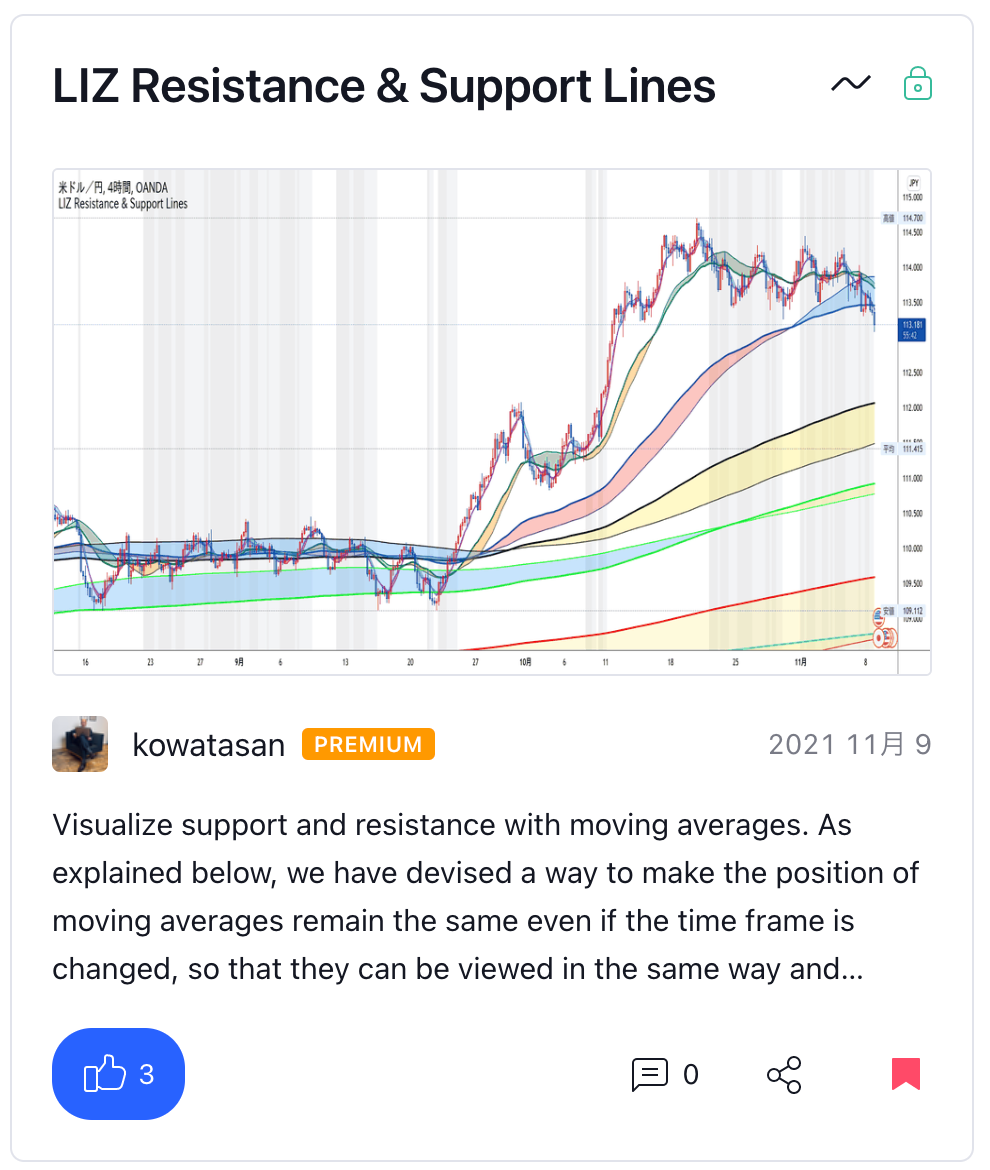
This indicator displays both the EMA installed in "TimeDimenSion" and the SMA set for the same period at the same time, and automatically colors between the EMA and SMA.
Whether or not the price has completely broken through the resistance band by the moving average line requires confirmation that both of these two moving average lines have been broken. It can be found in
It is an indicator made to avoid such a failed trade.
Tradingview's script information about this indicator is here
Share

