スマートオンライントレード講座バウハウス
W Stch&Trend (limited discount for graduates)
W Stch&Trend (limited discount for graduates)
Couldn't load pickup availability
Stochastics, a major indicator as an oscillator.
There are various oscillators such as RSI, but there is no point in arranging many similar ones.
Even if there are some differences, the display will be almost the same, so I chose only one Stochastic.
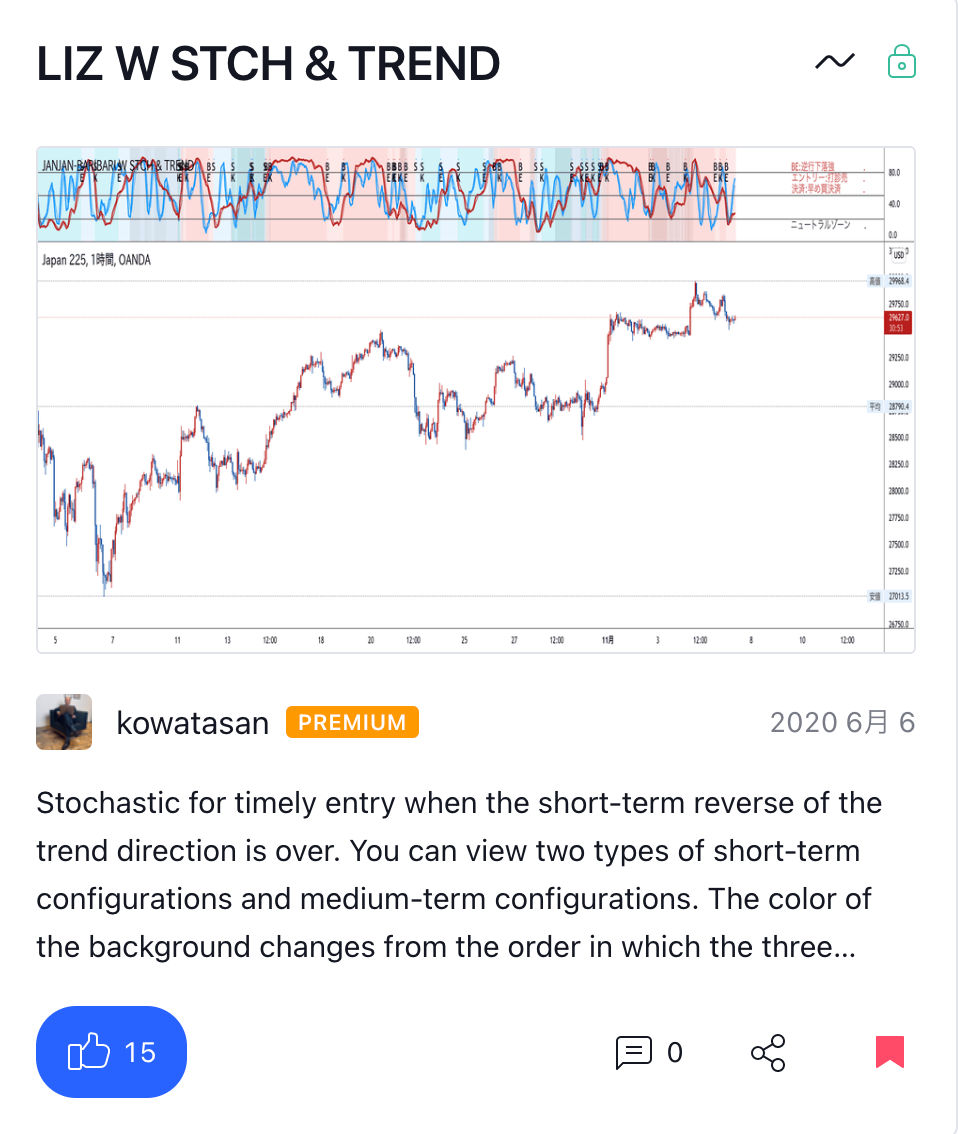
Short-term and medium-term stochastics can be displayed overlaid.
There is a difference from other general ones. The background color changes according to the arrangement of the moving average lines in the EMA and TimeDimenSion, which are separate products, and indicates whether the current trend is an upward trend or a downward trend.
The information and the situation indicated by the short-term stochastic are displayed in text without analysis, so even those who cannot analyze it yet can understand the current situation by reading the text. .
The blue short-term stochastic is the oscillator we always use, regardless of the trend. Watch it to prevent high-price-buying and low-price-selling, and to grasp the proper entry timing.
In addition, the red medium-term indicator is used when contrarian when the market is in a range market or when the market price rises (falls) while undulating.
There is a video that explains how to use it in detail, so if you are interested
Learn from here.
Tradingview's script information about this indicator is here


